
QGIS For Beginners Exercise – 4 / Map Composition తెలుగులో నేర్చుకుందాం

Exercise – 4 / Map Composition


Map composition for Printing or Graphic Export

QGIS has a powerful tool called Print Composer that allows you to take your GIS layers and package them to create maps.

Setting up a Map Layout

Now that we have a map with symbology & labels display (See Figure 67 - Map after displaying Labels) it’s time to prepare a Basic Map composition.

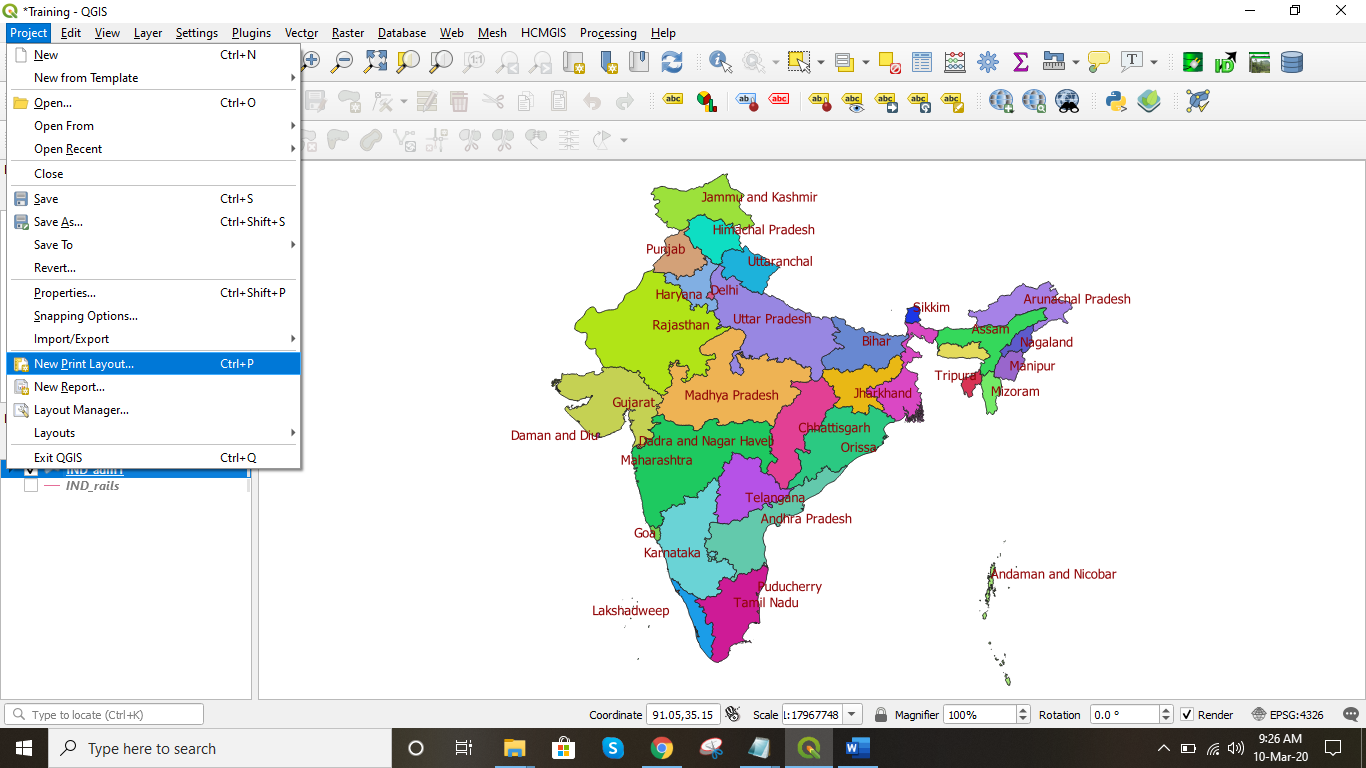
  • Choose Project → New Print Layout → Provide a title to the print layout → Click on OK.
  • New layout window will be created.

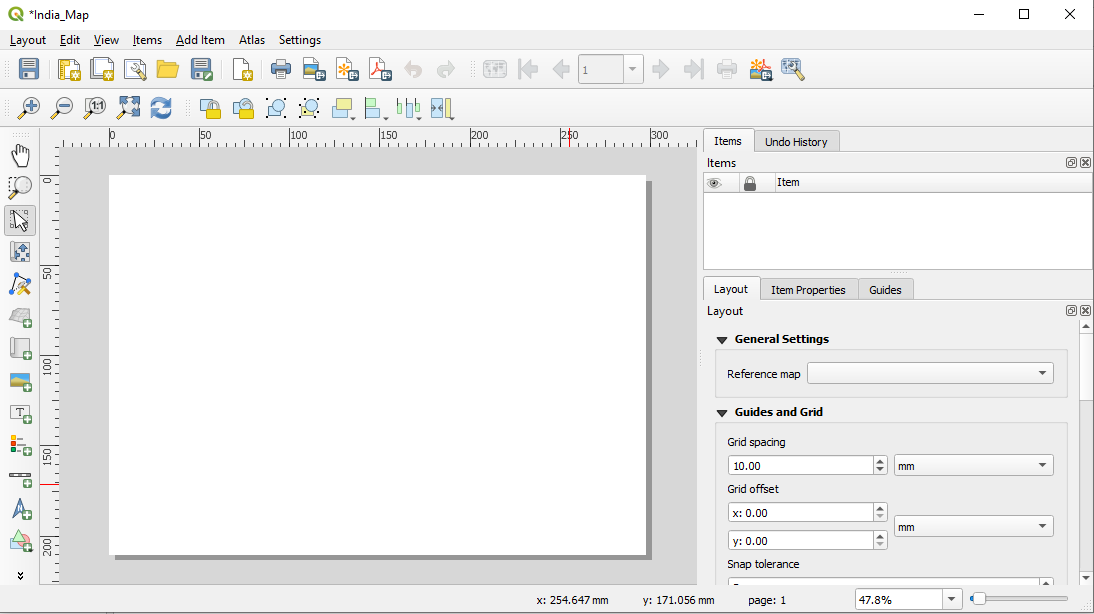
Figure 69 - New Print Layout window

  • Go to Layout → Page Setup → Provide page size, print source and orientation and click on OK.

Figure 70 – Page Setup Window

Inserting a Title, North Arrow, Scale Bar and Legend

  • Choose Add item in the menu bar and select Add Map, black cursorwill be display, drag the cursor from top left corner to bottom right corner to add the map displayed in the canvas.
  • After adding map to layout create borders around the map;
  • Select the layout
  • Go to Item Properties at the left panel
  •  Select Frame
    • Select Color
    • Thickness 
    • Join Style (Bivel/Miter/Round)

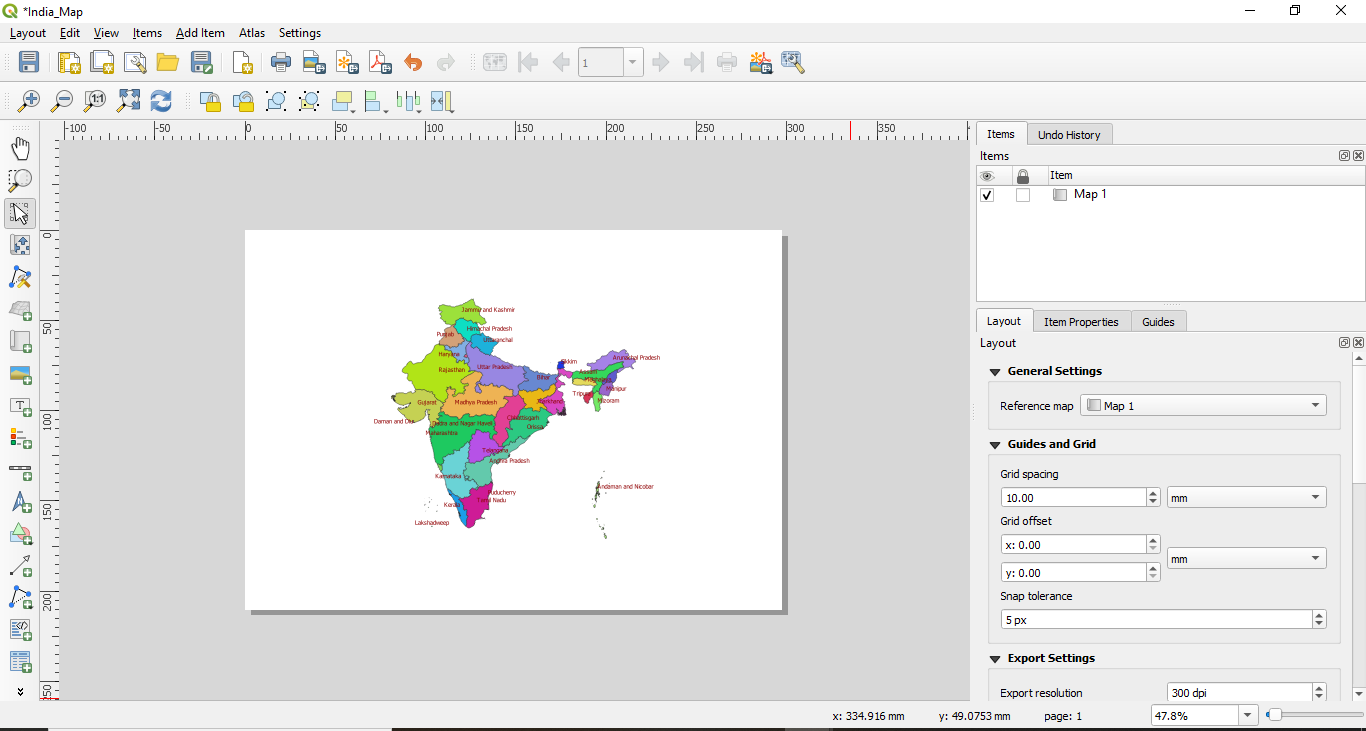
Figure 72 Item Properties for Frame


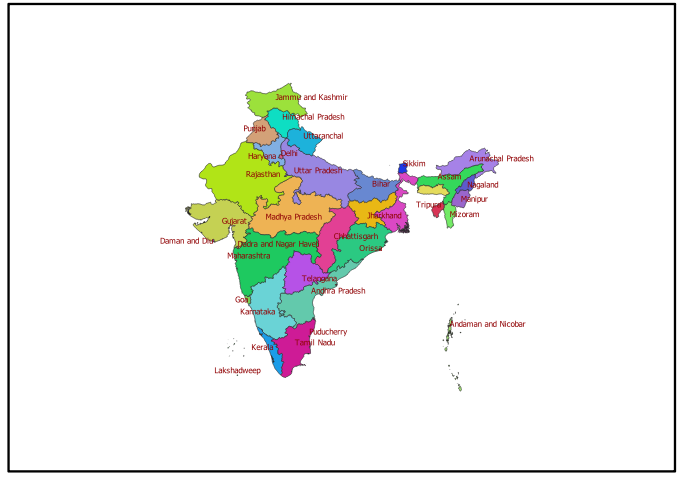
Figure 73 - Layout view with Frame

  • Choose Add item in the menu bar and select Add Label, black cursor will be display, drag the cursor where map title will be added.
    • Go to Item Properties at the left panel
    • Provide Map title 
    • Font Type & Size
    • Font Color


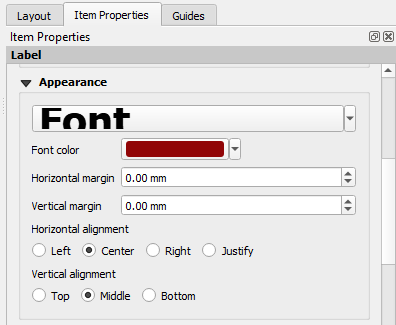
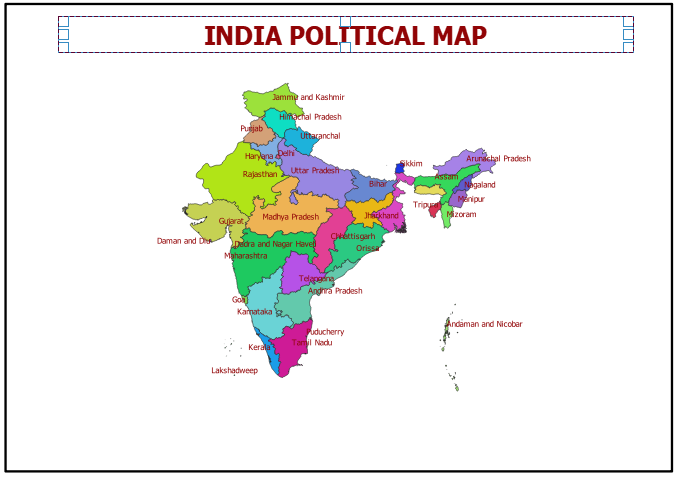
Figure 76 - Layout view with Map Title

  • Choose Add item in the menu bar and select Add Legend, black cursor will be display, drag the cursor where map Legend will be added.
    • Go to Item Properties at the left panel
    • Provide title as Legend 
    • Base on the requirement change the parameter as shown in figure 72


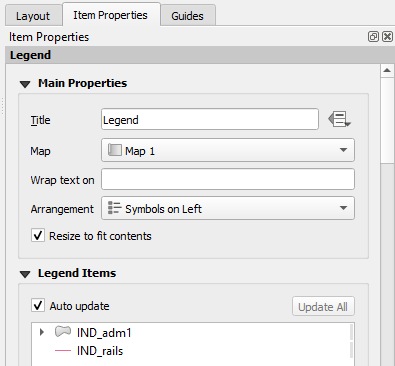
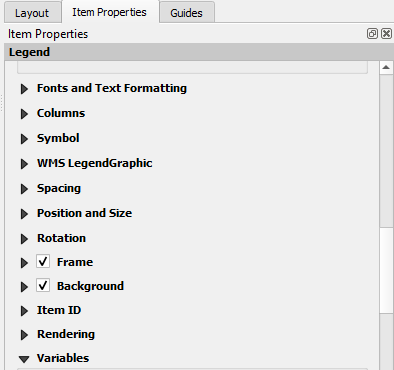
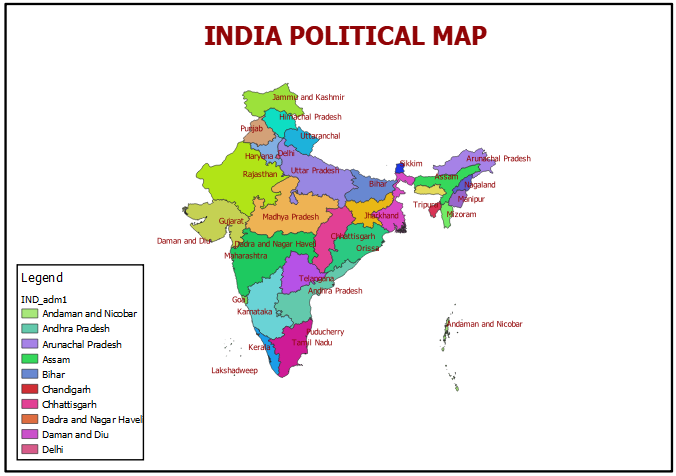
Figure 79 - Layout view with Legend

  • Choose Add item in the menu bar and select Add Scale Bar, black cursor will be display, drag the cursor where map Scale Bar will be added.
  • Go to Item Properties at the left panel
  • Under Scalebar
    • Main Properties
      • Map – Leave default
      • Select Scalebar Style


  • Define Units


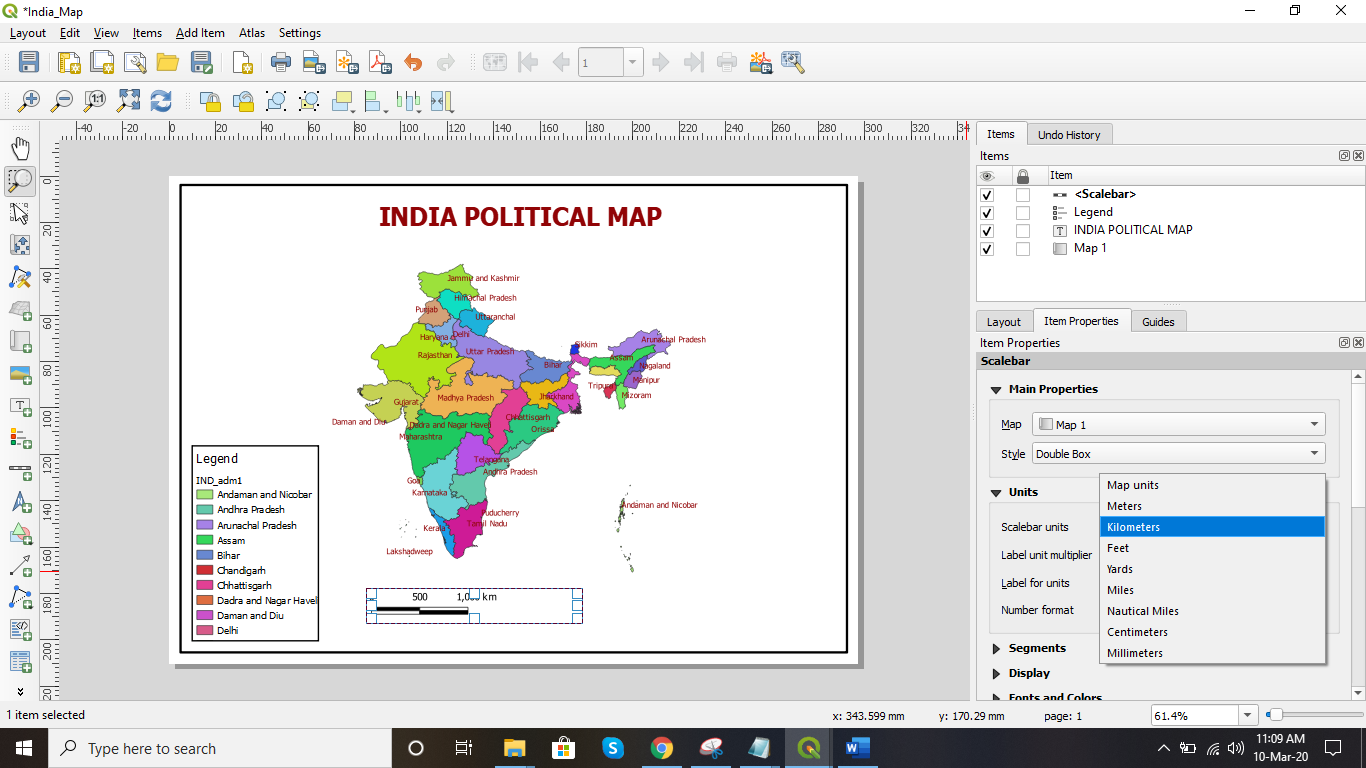
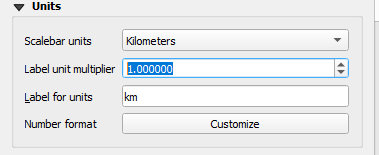
  • Define label unit multiplier
  • Labels for units
  • Number format

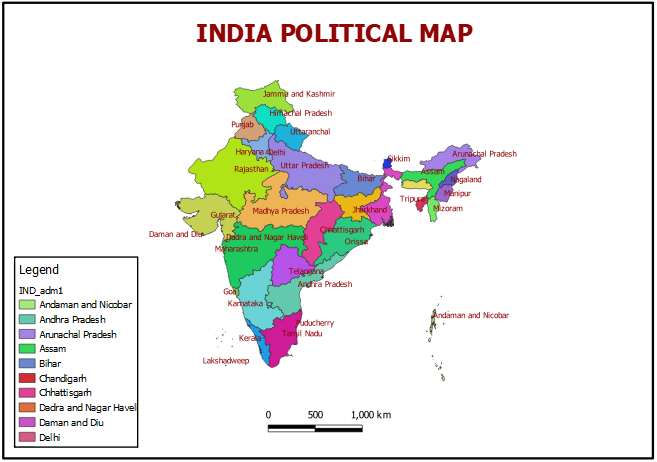
Figure 83- Layout view with Scalebar

  • Choose Add item in the menu bar and select Add North Arrow, black cursor will be display, drag the cursor where map North Arrow will be added.
    • Default North Arrow will be added.
    • To change the default north arrow, go to Item Properties at the left panel under Search Directories select the north arrow.

Figure 84 - Search Directories window for north arrow styles

  • To change the color of the north arrow, provide the fill color & stroke color as show in the figure 79.

Figure 85 - SVG Parameters window for changing color of North arrow


  • After the completion of Map composition click on Save project .

Figure 86 - Layout view with North arrow

Printing or Exporting your Map

  • Now that we have a basic map with title, legend, scalebar & north arrow it’s time to print the composed map or export the composed map to pdf. 
  • To print the map in hard copy, choose Layout → Print → select printer from available printers and click on Print.

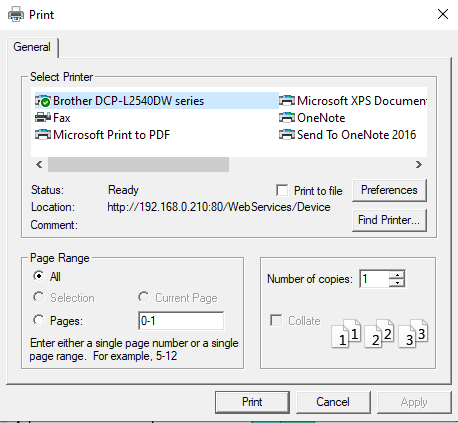
Figure 87 – Print Window


  • To export the map as Image / pdf or svg ,choose Layout → Export as Pdf or Export as IMAGE or Export as SVG and click on Save

Figure 88 - Save as pdf, image or SVG window

  • Close the Composer window.
  • Save your map.
  • Find your exported IMAGE / PDF or SVG using your operating system’s file manager and Open it.

Comments

Popular posts from this blog

How to Rename attribute fields in QGIS & How to Rearrange attribute fields in QGIS | తెలుగులో నేర్చుకుందాం

How to Rename attribute fields &  Rearrange attribute fields in QGIS Refactor fields Refactor fields, allows editing the structure of the attribute table of a vector layer. Fields can be modified in their type and name, using a field’s mapping. The original layer is not modified. A new layer is generated, which contains a modified attribute table, according to the provided fields mapping. Refactor layer fields allows to: Change field names and types Add and remove fields Reorder fields Calculate new fields based on expressions Load field list from another layer Add Vector Layer to Layers panel to Drop field(s) Choose Processing → Toolbox → Vector table → Refactor fields Figure 178 - Vector layer with attribute table before Refactor fields Select Input Layer (Ex: Ind_adm1) Select fields to be renamed and reorder (Ex: in the below given example Name_0 has to rename as Name with Length from 75 as 100 and change order of Name_1 under Name_0 [Name after rename] ) Figure 179 - Fi...

Exercise – 15 / How to Create Topology in QGIS తెలుగులో నేర్చుకుందాం

Exercise – 15 /   How to Create Topology in QGIS Topology Creation Topology describes the relationships between points, lines and polygons that represent the features of a geographic region. With the Topology Checker plugin, you can look over your vector files and check the topology with several topology rules. These rules check with spatial relations whether your features ‘Equal’, ‘Contain’, ‘Cover’, are ‘CoveredBy’, ‘Cross’, are ‘Disjoint’, ‘Intersect’, ‘Overlap’, ‘Touch’ or are ‘Within’ each other. It depends on your individual questions which topology rules you apply to your vector data (e.g., normally you won’t accept overshoots in line layers, but if they depict dead-end streets you won’t remove them from your vector layer). QGIS has a built-in topological editing feature, which is great for creating new features without errors. But existing data errors and user-induced errors are hard to find. This plugin helps you find such errors through a list of rules. It is ve...

What is Survey Of India (SOI) Framework?

What is Survey Of India (SOI) Framework? The Survey of India (SoI) framework is a geospatial reference system used in India for mapping, surveying, and geodetic purposes. The framework is maintained by the Survey of India, which is the national mapping organization of India and the oldest scientific department of the Government of India. The SoI framework is based on the Indian Terrestrial Reference Frame (ITRF) and the Indian National Spatial Reference System (IN-SRS), and is used to determine the location and height of points on the Earth's surface with high accuracy. The framework is also used to define the horizontal and vertical reference systems for mapping and surveying purposes in India. The SoI framework provides a consistent and accurate basis for various geospatial applications, such as land management, urban planning, navigation, disaster management, and environmental monitoring. The framework is also used for the production of topographic maps, cadastral maps, and othe...