Exercise – 2 / Symbology
The symbology of a layer is its visual appearance on the map. The basic strength of GIS over other ways of representing data with spatial aspects is that with GIS, you have a dynamic visual representation of the data you’re working with.
Therefore, the visual appearance of the map (which depends on the symbology of the individual layers) is very important. The end user of the maps you produce will need to be able to easily see what the map represents. Equally as important, you need to be able to explore the data as you’re working with it, and good symbology helps a lot.
In other words, having proper symbology is not a luxury or just nice to have. In fact, it’s essential for you to use a GIS properly and produce maps and information that people will be able to use.
Defining the General Symbology Properties for Shapefiles
- Let’s add layer to the canvas (Data View) and to change / add the symbology open Layer Properties by right click on the Layer.

Figure 16 – Map before applying Symbology
- In the Layer Properties Window select the Symbology tab;

Figure 17 - Layer Properties Window
- Click the color select button next to the Color label. A standard color dialog will appear.
- Choose a color and click OK. (Procedure for applying symbology for Line and Point follows the same.)
- Click OK again in the Layer Properties window, and the color change being applied to the layer.

Figure 18 – Map after applying Symbology
Symbology based on an Attribute Value
To create a map, one has to style the GIS data and present it in a form that is visually informative. There are a large number of options available in QGIS to apply different types of symbology to the underlying data. We will style a vector layer to show unique colors to individual states of INDIA.
- Let’s add layer to the canvas (Data View) and to change the symbology (Ref: Figure 18)
- Right click on the layer name and select Open Attribute Table. To style a layer, we must pick an attribute or a column that would represent the map we are trying to create. Since we want to create a layer representing unique color to states in India, the field NAME_1 is the attribute to use for styling.

- Close the attribute table and right click on the layer and open Layer Properties,In the Layer Properties Window select the Symbology tab.
- Click on Single Symbol to display the categories of symbology and select Categorized.In this stage Single Symbol style isn’t useful as we are trying to create unique symbology map. This time choose Categorized from the Style tab. Categorized means the features in the layer will be shown in different shades of a color based on unique values in an attribute field.
Note: Procedure for applying unique symbology based on attribute values for Line and Point follows the same.

Figure 20 – Layer Properties window with Value and Color ramp
- Now, select the Value and provide the attribute field on which symbology has to be created (See Figure 19 for attribute value).
- Choose NAME_1 value as the Column. Choose a color ramp as Random colors and choose your choice and click Classify at the bottom. Click OK.

Figure 21 - Map after applying unique Symbology with Attribute values
Labelling a Layer Based on an Attribute Field
Labels can be added to a map to show any information about an object. Any vector layer can have labels associated with it. These labels rely on the attribute data of a layer for their content.
- Right click on the layer and open Layer Properties window.
- Select Labels and click on No Labels and select Single Labels
- In Value provide the attribute field for which label need to display (See Figure 19 for attribute value).
- Choose NAME_1as value to be labelled and select Text for font style, size, color etc., and click OK.

Figure 22 – Layer Properties window for Labels.

Figure 23 - Map after displaying Labels
Note: Procedure for displaying the labelsbased on attribute values for Line and Point follows the same.
Multiple Label Display Based on an Attribute Field
- Right click on the layer and open Layer Properties window.
- Select Labels and click on No Labels and select Rule-based Labeling
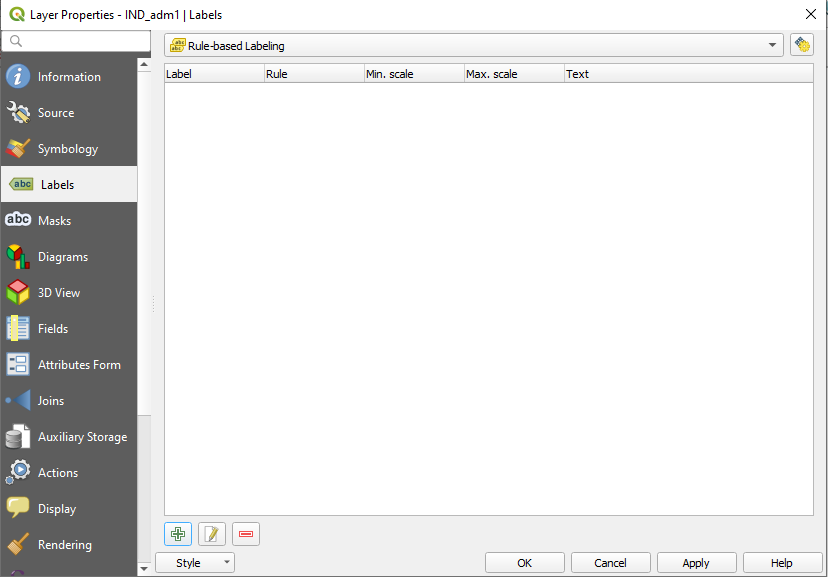
Figure 24 - Layer Properties window for Rule-based Labeling.
- At the bottom of the window click on to create a rule for label display.
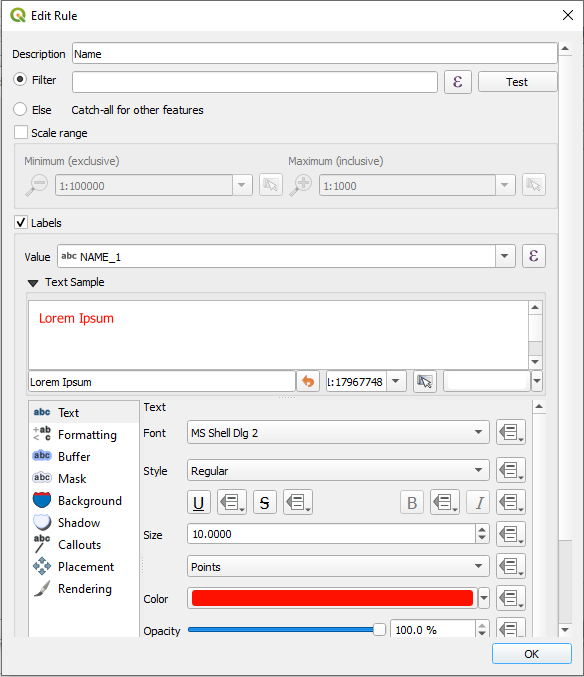
Figure 25 - Edit Rule window for label display
- Provide Description for the label to be display.
- Under Labels provide value from the dropdown box and select the attribute value. Choose NAME_1as value to be labelled and select Text for font style, size, color etc., and click OK.
- Now again click to create a rule for another label to be displayed.
- Provide Description for the label to be display.
- Under Labels provide value from the dropdown box and select the attribute value. Choose TYPE_1as value to be labelled and select Text for font style, size, color etc., and click OK.

Figure 26 - Edit Rule window for label display
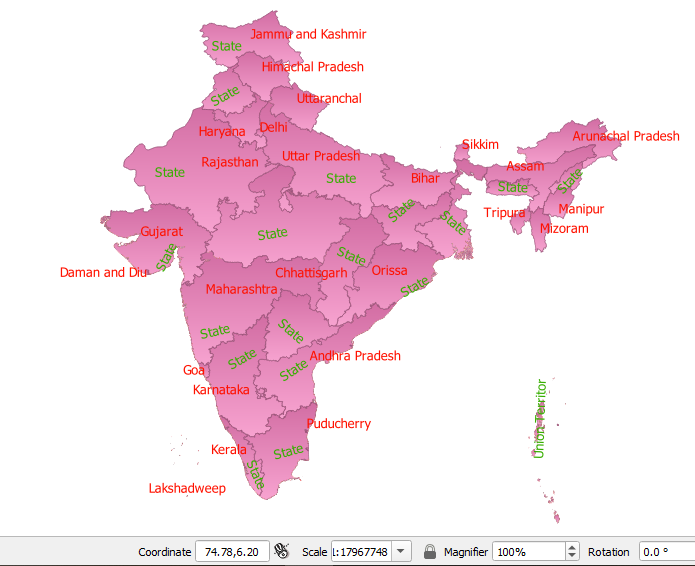
Figure 27 - Map after displaying Multiple Labels
Note: Procedure for displaying the Multiple labelsbased on attribute values for Line and Point follows the same.
Comments
Post a Comment